For anybody who has watched European soccer over the past five years you've probably seen something about expected goals. It's become the most popular advanced statistic within the soccer community to determine how good a player or team is.
What is Expected Goals?
The idea behind expected goals is it gives an indication of whether results are based on sustainable factors like a steady creation of scoring chances, or whether it is down to aspects such as luck or outstanding goalkeeping.
Expected Goals models can be different based on the data available. My model is based on shot zones. There are four shot zones in my model: (1) Inside the 6-yard box, (2) Inside the Penalty Area, (3) Outside the Box, and (4) Penalties.
[Looking to bet on the Bundesliga? Check out PointsBet. NJ and IN only.]
Link your PointsBet and Action accounts so your Bundesliga bets automatically sync over to the app.
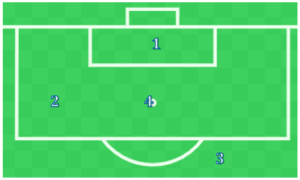
Expected Goals (xG) by shot zone is a number between 0 and 1, which is the percentage change of scoring. An expected goal of 1 is the highest number possible for a zone, meaning it has a 100% chance of scoring.
The theory of expected goals is the closer the shot is to the goal, the better the chance it has at going in. A shot from zone 1 (Inside the 6-yard box) will have a better chance of going in than a shot from zone 3 (Outside the box). For penalties, the standard used is 0.76 xG, since the amount of penalties for a team is up to judgement of a ref.
A couple of very helpful websites for advanced soccer stats that I use are WhoScored and UnderStat. All of the expected goals numbers I use for my model are from UnderStat.
Calculating Expected Goals (xG)
Using data from UnderStat to figure out the number of expected goals, I divide the number shots by location by the number of games played. Then I multiply the shots per game by location by the expected goals per shot by location. Form there, I am able to figure out the xGF and xGA per game by shot location:
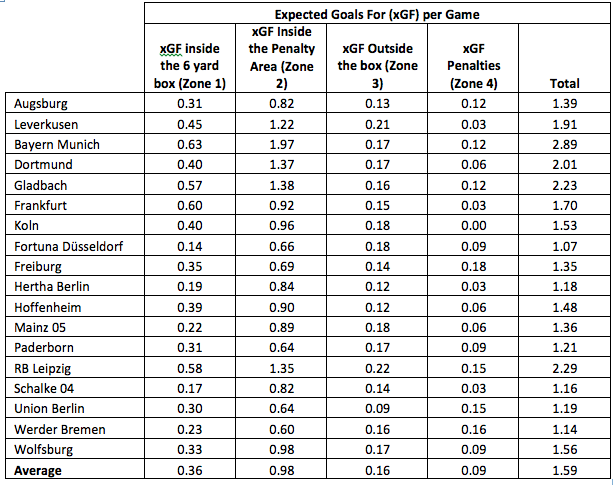
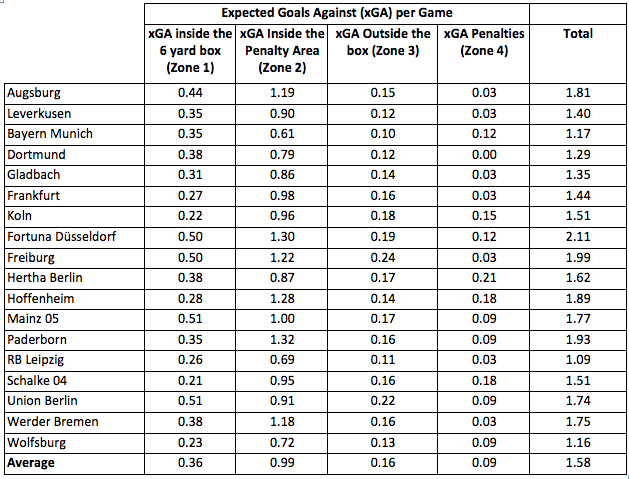
Once I have the number of expected goals per game by location, I take each teams' xGF times the opponent’s xGA for each location divided by the average for each location:
((Dortmund xGF Zone 1 x Schalke 04 Zone 1 xGA)/(Zone 1 xG Average)) = Dortmund Zone 1 xG
Once I have the total amount of expected goals, I adjust each team's expected goals for home field advantage. Based on historical data from the last five years in the Bundesliga home field advantage is worth around 0.34 xG. I take 0.34 divided by 2, then I add 0.17 xG to the Home Team and subtract 0.17 xG from the away team, to not effect the total amount of expected goals.
If we use this formula for each location for each team and add +0.17 xG for the Home team (Dortmund) and -0.17 xG for the Away Team (Schalke 04) you get the following expected goals by location for each team:

Calculating Win Probability
Once I have the expected goals for each team, I use poisson distribution to calculate the probability of each team winning and the possibility of a draw.
If you would like to read more about poisson distribution, this article was very helpful in building my model.
The Poisson Distribution returns the following win probabilities:
- Dortmund: 67.08% (-204)
- Draw: 19.38% (+404)
- Schalke 04: 13.10% (+664)
Calculating Expected Value
I then compare my lines calculated above to the actual line to find the expected value. The formula for that is (My Line – Sportsbook Line).
Sportsbook Line (DraftKings):
- Dortmund: -190 (65.52%)
- Draw: +310 (24.39%)
- Schalke 04: +500 (16.67%)
Expected Value:
- Dortmund: (67.08%) – (65.52%) = +1.56%
- Draw: (19.38%) – (24.39%) = -4.56%
- Schalke 04: (13.10%) – (16.67%) = -3.57%
Expected goals has become the most popular advanced stat used in predicting soccer matches over the past few years. Combined with poisson distribution, expected goals can be very useful in predicting the outcome and finding value in a soccer game.


