


March Madness Betting Trends, Stats, Notes: Action Network Betting Primer
Before we start — it's important to know this is a live running article. Content, matchups, odds, trends, and systems will all be added to the piece through the end of the first round of action on Friday, March 20 (check the updated as-of date below!).
We're here to answer tourney questions, dish out stats and facts, talk futures, the bracket, coaches, Cinderellas and more. Welcome to the March Madness edition of Action Network's betting primer.
All data, stats and trends are updated as of Friday, March 20, 1 p.m. ET.
14 & Proud
Connecticut's ATS Journey
The undefeated Huskies. Connecticut enters the 2026 NCAA Tournament on a 14-game ATS win streak in the Big Dance, the longest ATS win streak for any team in the seeding era — including 14-0 ATS in total over the last three NCAA Tournaments.
Most Consecutive NCAA Tournament ATS Covers Since 1979
- UConn 14 (2023-25)
- West Virginia 12 (1998-08)
- Villanova 11 (1985-88)
Dan Hurley is 17-3 ATS (85%) in the NCAA Tournament as a head coach, which is the highest ATS win percentage for a coach (min. 10 games) in the seeding era since 1979.
Dating back to the 2008-09 NCAA Tournament, the Huskies are 30-6 ATS in the dance, including 11-0 ATS as a favorite of seven points or more in the tournament since that 2009 date, with Hurley being 8-0 ATS in the NCAA Tournament as a favorite of 7+ points.

Strong Seeds
Top Four Dominate
The 16 top-4 seeds are favored in the Round of 64 by a combined 354.5 points, which is the record for top-4 seeds in the Round of 64 since the tournament expanded back in 1985, which was set in 1996 at -300.
The record for average spread for top-4 seeds in Round 64 is 18.75 in 1996, 18.4 last year and as of now without the one 1 seeds, 2026 is at 22.2.
All 16 top-4 seeds are also double-digit favorites in the Round of 64 — the first time that has happened since the tournament expanded in 1985. We have ten teams favored by at least 20 pts in the Round of 64 — the previous record since 1985 was just six such games.

Momentum Matters Sometimes
Don't Lose Early
Since seeding began in 1978, every NCAA champion to play in a conference tournament won at least one game in that appetizer for March Madness. In that span, eight champions never actually had a conference tournament ('97 ARI, '95 UCLA, '89 MICH, '87 IU, '81 IU, '79 MSU, '78 UK, '77 MARQ).
If this trend holds true, here are some of the candidates this eliminates this year: UNC, Miami (OH), Villanova, Michigan State, Nebraska, Illinois, Texas Tech, Alabama and Saint Mary's.
Round of 64 games can go the other way — teams coming off an outright win entering the Round of 64 facing a team who lost their last game are just 31-113 (21.5%) straight up since 2016-17 and they went 3-16 straight-up last year. Here are those teams: Akron, Cal Baptist, Furman, Hofstra, Idaho, McNeese State, N. Dakota State, Penn, USF, Tenn. State, Troy, Utah State, VCU, Wright State

They Are Free!
Back Best FT Teams
Hit your free throws kids. To say it simply, good free throw shooting teams have historically had covering success in the tournament. Teams averaging 75%+ from the stripe have been cashing at a 56.5% rate with a 9% ROI since 2008 NCAA Tournament.
Raise it to 76%, it's 16.1% ROI and at 77%, it's been historically a 21.8% ROI. Teams shooting 77% or higher on the year are 97-56-2 ATS (63.4%) in the NCAA Tournament in this span.

Where free-throw shooting is most important is in tight games. At 77%+, when the spread is six or less, that good free-throw team is 60-34 ATS (64%), with a spread of four or less, they are 39-19 ATS (67.2%), covering the spread by 4.1 points per game.
Round of 64 matches: Illinois, Ohio State, St. Mary's, Siena, Tenn. State, UMBC

Inflation Issues
Ice Cold
Don't always believe what you just saw. Since the 2013 NCAA Tournament, teams to win by 20+ points in the Round of 64 are 25-44-1 ATS (36.2%) in the Round of 32 when their opponent won by less than 20 points in the Round of 64.

Data Dump
Info on Every Team
Here is a searchable database of all 68 NCAA Tournament teams. Enjoy.

Cinderella Rollercoaster
Ups and Downs
According to our Bet Labs database, after a team pulls off a double-digit point spread upset in the NCAA Tournament, they are 4-20 straight up and 8-16 against the spread in the next round, dating back to 2005.
After pulling the upset in the previous round, teams that get the majority ticket count ATS in their next game are 1-16 SU and 4-13 ATS in this span, with the only win coming from Florida Gulf Coast back in 2013.
Perfect Dogs
Miami-Ohio's Journey
Miami-Ohio went undefeated in the regular season, becoming the 7th team to do that since seeding began in 1978 & play in NCAA Tournament. Of those seven teams — 2021 Gonzaga, 2015 Kentucky, 2014 Wichita State and 1991 UNLV were favored in all their tourney games. 2026 Miami (OH) joins 2004 Saint Joseph's and 1979 Indiana State as teams to go undefeated in regular season and be an underdog if any NCAA Tournament game — both Indiana State (to Michigan State) and Saint Joseph's (to Oklahoma State) lost their games outright.

Double The Fun
Power 6
Double-digit seeds in power 6 conferences — ACC, Big East, Big Ten, Big 12, Pac-12 and SEC — have had NCAA Tournament success covering the spread, they are 82-50-4 ATS (62%) against top-9 seeds dating back to 2010-11. This year that is Texas A&M, UCF and Missouri.

Cover Country
Big Ten Dominance
Since the 2011 NCAA Tournament, the Big Ten is 59-34-3 ATS in the Round of 64, the best mark of any conference.
The Big Ten has gone eight straight tournaments .500 ATS or better in the Round of 64, including .500 ATS or better in 13 of the last 14 tournaments.
Let's take a look at the best and worst conferences against the spread in the NCAA Tournament over the last five tournaments…
Conferences ATS in NCAA Tournament
 The Best |  The Worst | ||
| 1. | Big East: 37-21 ATS | Mountain West: 10-21 ATS | |
| 2. | ACC: 40-28 ATS | SEC: 43-50 ATS | |
| 3. | Pac-12: 25-17 ATS | WCC: 11-16 ATS | |
| 4. | Horizon: 6-1 ATS | Big South: 0-5 ATS | |
| 5. | Southern: 5-1 ATS | Missouri Valley: 3-7 ATS | |
| Updated as of March 16th | |||

NIL Era
Follow The Money
How has Cinderella performed lately? In the NIL era, not so good.
13 to 16 seeds in the Round of 64 are 6-58 (9.4%) straight up and 25-39 (39%) against the spread since 2021, with a moneyline bettor losing 13.7% ROI and an ATS bettor 25.3%. The ATS bettor is failing to cover by 1.86 PPG.
- Between 2016-20: 8-56 SU, 33-29 ATS (+1.26 cover margin)
- Between 2015-15: 9-55 SU, 35-28-1 ATS (+0.56 cover margin)
Favorites of eight points or more went 21-0 SU in the NCAA Tournament last year — tied for the second-most SU wins without a loss for 8+ pt favorites in history behind 22-0 SU mark in 2007. Those 8+ point favorites are 57-5 SU over the last three NCAA Tournaments, including 19-0 after the Round of 64.
Favorites went 14-1 SU in the Sweet 16 or later in last year's tournament, the best record for any season in the seeding era.

Dog Experience
Cover It Now
Early in the NCAA Tournament, experience can help. Since the 2018 dance, coaches with more NCAA Tournament game experience than the opposing coach, who are listed as underdogs, are 30-16 ATS in the Round of 64.
As of now this year that is: Missouri, Clemson, Villanova, Akron, Santa Clara, Pennsylvania, TCU

Early Unders
First Half Time
Since PASPA was repealed in May of 2018, unders are 222-175-4 (55.9%) in the NCAA Tournament. Unders are .500 or better in each of the six tournaments in that span. But this is about first-half unders.
Since the 2012 NCAA Tournament, games played at 1 p.m. ET or earlier in March Madness have seen the under go 67-44-3 (60.4%) in the first half with a +14.5% ROI. Since the 2018 tournament, this is 32-26 to the first half under.
First-half unders in the NCAA Tournament overall are 254-207-7 (55.1%) since 2018. When those games are played in the Round of 64, they are 123-97-3 (55.9%) to the under.
Mountain Cover Up
Tough Going
Since 2016, the Mountain West conference is 13-26 ATS (-$1,414 on $100 bet, -36% ROI) in the NCAA Tournament. That is the lowest ROI of any major conference and the least profitable of any conference against the spread.
In the last 17 tournaments dating back to the start of the 2007 season, the Mountain West has been above .500 ATS in a single tournament once, back in 2018.
Mountain West teams seeded ninth or worse are just 9-29-2 ATS in the NCAA Tournament, including going 5-35 SU in those games.

Quiet on the Western Front
Is This The Year?
Since Arizona won the national title in 1997, no team west of Texas has won it all.
Skyfall
Can Vandals Break It?
Since the 2000 NCAA Tournament, the Big Sky Conference has had its issues in the Big Dance. Overall, the Big Sky is 1-25 SU and 7-17-2 ATS in the NCAA Tournament, with the only SU win coming from Montana back in 2006, with the conference losing 19 consecutive games in the tourney.
Since the 2006-07 NCAA Tournament, the Big Sky is 3-14-1 ATS in the NCAA Tournament.
Two and Out?
Big Odds
Purdue was 30-1 to win it all before Selection Sunday, now down to 25-1 — all coming as a 2-seed.
Since 1985, we’ve seen 16 top-2 seeds to enter the tournament with future odds of 25-1 or longer — none made the title game, with one making the Final Four, Minnesota back in 1997. Of those 16 teams, 11 didn’t make the second weekend.
Virginia is a 3-seed in this year’s NCAA Tournament but still has 80-1 odds to win it all. Since the 2003 dance, only two other top-3 seeds have been 80-1 or higher entering the dance — and both got bounced in the Round of 32:
2022 (3) Wisconsin, 80-1
2016 (3) Utah, 100-1
March Madness 2025
Futures | Matchups | Coaches | Bet Labs | Public | Trends | First Four | Upsets |

Future Markets & Notes
Here's a look at the BetMGM futures market, from opening to current lines to win it all:
What are the highest odds to win the title entering the NCAA Tournament since seeding began in 1978? Only four teams listed above 20-1 entering March Madness have won the title in that same time frame:
2014 Connecticut
100-1 pre-tournament
1985 Villanova
35-1 pre-tournament
2011 Connecticut
25-1 pre-tournament
1983 NC State
25-1 pre-tournament
After flip-flopping down the stretch, Michigan overtook Duke to be the favorite to win the NCAA Tournament entering Selection Sunday and then once the bracket came out, Duke moved up to the top spot.
How have pre-tournament favorites performed in March Madness recently? The pre-tournament favorite has gone on to win it all 11 times since 2000, including the last two years, with Florida last year (was tied with Duke at the top) and UConn the year before. That was the first time we've had the pre-tourney favorite win it all in consecutive years since 2017-18.
The pre-tournament favorite hasn't won it all in three straight years since seeding began in 1978.
 |  |  |  |  |  | |  |  |
➤Last pre-tournament favorites to lose in the first weekend since 1990: 2010 Kansas, 2004 Kentucky, 1994 UNC, 1990 Oklahoma.
How has the preseason favorite to win the national title performed in March Madness?
Purdue
This year's preseason favorite entering the regular season was Purdue, which was +750, with Houston at +900 right behind it. Purdue and Houston were the only two teams listed below 10-1 entering the season.
The preseason favorites entering last year were Kansas and UConn — Kansas lost in the Round of 64, while UConn was bounced in the Round of 32 by the eventual champion, Florida Gators. Kansas entered 2023 as the preseason favorite as well and was knocked out in the Round of 32.
In 2021, Baylor and Gonzaga were preseason favorites and met in the title game (Baylor won it all). Prior to that, the last preseason favorite to win it all was North Carolina at +500 back in 2009.
Preseason favorites to make Final Four since 2009:
2021 Baylor
+800 preseason
2021 Gonzaga
+800 preseason
2014/2015 Kentucky
+300/+400 preseason
2009 North Carolina
+500 preseason

Matchups: Tuesday/Wednesday/Thursday Games


UMBC has won 12 consecutive games outright entering the NCAA Tournament, the second-longest streak for any tourney team behind just High Point (14).
Under head coach Jim Ferry, UMBC has been a double-digit underdog 19 times — it's 0-19 SU but 13-6 ATS in those games.
This will be Howard’s third NCAA Tournament appearance under Kenny Blakeney. In its first two appearances in 2023 and 2024, it went 0-2 SU and ATS, losing in the First Four and Round of 64.


Prairie View owns the nation’s longest ATS winning streak, currently at 11 games dating back to Valentine’s Day, Feb. 14 which started the streak.
Under Brett Reed at Lehigh, the Mountain Hawks have played three NCAA Tournament games — Lehigh is 3-0 against the first-half spread in those games, staying in it early.


Troy knocked off Georgia Southern back on Monday, the ninth, and now they play on Thursday. This season, Troy is 5-0 SU and ATS when playing on five days rest/prep or more (including opener).
Since 2012-13, Troy head coach Scott Cross is 91-71-2 ATS (58%) as an underdog with UT Arlington and Troy. He is .500 ATS or better as an underdog in 12 of 13 seasons.
Nebraska is 11-0 SU vs. non-conference opponents this season, winning by 17.5 PPG — that includes four games where the Huskers were either dogs or favored by less than 5 pts. Historically, Fred Hoiberg’s teams have performed well in March, going 32-20-2 ATS.

Louisville has failed to cover the spread in five straight NCAA Tournament games dating back to 2015. That marks the program’s longest ATS losing streak in the tournament over the past 50 years.


High Point has won 14 consecutive games entering the NCAA Tournament, going 22-1 SU in their last 23 games. This season, High Point has been favored in all 34 games, with the last game it was an underdog coming in the Round of 64 vs. Purdue last year.
Greg Gard has coached 14 NCAA Tournament games with Wisconsin — he is 6–7-1 ATS — 4-1-1 ATS as an underdog and just 2-6 ATS as a favorite.
Wisconsin hasn't been the school to ever be upset. As a favorite of above 7 pts in the NCAA Tournament, Wisconsin is 11-0 SU over the last 60 years.

Siena has played 34 total games this season, and it's 23-11 to the under in those contests. Entering the NCAA Tournament, Siena games have gone under the total in 6 straight, including 9 of their last 10.
Duke has been a strong under team in the NCAA Tournament under head coach Jon Scheyer, with eight of his 11 tournament games finishing under the total. The trend gets even stronger in tighter matchups, as Scheyer’s teams are 4-0 to the under when the total is below 140 and 7-0 to the under when the spread is eight points or less.
Duke is 3-0 ATS in Round of 64 under Jon Scheyer (2023-25). Since 1985, Duke has yet to cover four straight in Round 64 entering this year. Since ’85, Duke was just 14-21 ATS in Round 64 under Coach K.


McNeese State is 28-5 SU this season, winning ten in a row outright in their first season under Bill Armstrong. McNeese State is 25-0 SU on the full game moneyline when either tied or leading at the half this year — they are 3-5 SU when trailing at the half.


North Dakota State has been a good first half team this season — going 24-10 1H ATS in their 34 total games this season, including 10-3 1H ATS in their last 13 games. Bison have been great first half away from home, too, going 15-5 1H ATS this season.
Michigan State played four NCAA Tournament games last season, making it to the Elite 8 — all four games went under the total, going 4-0 to the under.
In Tom Izzo’s NCAA Tournament career, he has never gone under the total in 5 straight games. Going back to 2022-23, Izzo is 7-2 to the under in the NCAA Tournament.
John Calipari is 21-3 straight up in Round of 64, but just 11-13 ATS in those games.
In the Round of 64, when Calipari’s teams are -17 or higher as a favorite, they are just 2-9 ATS if the line gets that high vs. Hawaii. Cal is 6-11 ATS as a double-digit favorite in the Round of 64.
Hawaii has played six NCAA Tournament games in its schools history — they are 1-5 SU in those games, 1-1 SU when the game is played in PST and 0-4 SU outside PST.


For Kelvin Sampson, the issues came later in the tournament. Since 2005, he is 11-7 ATS in the Round of 64 and 32, and 4-8 ATS in the Sweet 16 or later. In his coaching career in the NCAA Tournament, Sampson has avoided the big upset, going 13-0 SU as a favorite of 8 pts or more.
As a favorite of 8 pts or more in the NCAA Tournament, Kelvin Sampson is 13-0 SU.
Entering the Big Sky Tournament, Idaho didn’t have a 3-game win streak this season. They’ve now won 5 in a row and are dancing after a 21-14 SU record.
Idaho is the 5th Big Sky team to enter tournament with 14+ losses — previous four teams went 0-4 SU, losing by 15 PPG.


When Gonzaga is seeded in the top-4 they are 1-6 ATS since 2021-22 and just 13-26-1 ATS dating back to the 2004-05 tournament.
Gonzaga wins the West Coast and gets automatic bid. Most of their tourney success has come with auto bid. Both 2017 and 2021 runner-ups and three of four Elite 8 trips (2023, 2015, 1999).
Matchups: Friday Games

Mark Pope has coached five total NCAA Tournament games with both Kentucky and BYU combined — in those games, the under is 5-0, going under the total by 7.5 PPG.
Kentucky has been a 7 seed or higher in the NCAA Tournament six times prior to this year — they are 9-5-1 ATS in those tournament games, with them last being this high of a seed in 2014 when they made the title game.


In Akron’s last six games entering the NCAA Tournament, the under is 6-0. When Akron plays a tight spread game this season, either as an underdog or favored by less than 10 points, the under is 9-4 this season.
The Red Raiders have had a bad history covering on a neutral court. They are under .500 ATS on a neutral court in each of the last six seasons, including this year. In that span, Texas Tech is 13-25 ATS on a neutral court.
Worst Record Neutral Court ATS Since 2020
1. Virginia Tech: 8-22 ATS
2. Temple: 9-22 ATS
3. St. Mary’s: 12-27 ATS
4. Washington St.: 11-22 ATS
5. Texas Tech: 13-25 ATS
(Min. 30 neutral games in span)


Arizona went 2-1 ATS in three NCAA Tournament games last year, breaking a 9-season stretch where the Wildcats were .500 ATS or worse in the dance (where they went 4-15-1 ATS).
Arizona hasn’t covered the spread in consecutive NCAA Tournament games, even year-over-year since the 2013 tourney — which it would do in Round 64 this year.


February 15, 2019 — the last time Wright State beat a top-100 Ken Pom team, using end of season rankings. They are 0-10 SU since the 2020 season and have lost 12 straight outright in this spot.
0-3 SU — 2025
0-2 SU — 2024
0-2 SU — 2023
0-2 SU — 2021
0-1 SU — 2020


Coming together at just the right time. Tennessee State enters March Madness on a 6-game SU and ATS win streak — their longest SU win streak since 2017-18.
Tennessee State has been a dog of 2+ points nine times this season — they are 6-3 SU and 8-1 ATS in those games, covering the spread by 10.8 PPG. As a dog overall, Tenn. State is 6-5 SU.

Over the last two seasons under Speedy Claxton, Hofstra has played 22 games as an underdog. Claxton is a respectable 11-11 SU and 15-7 ATS in those games, covering the spread by 5.2 PPG.
Don’t mind the higher totals. Nate Oats is 11-10 ATS in the NCAA Tournament. When the total is 155+, his teams are 7-3 ATS; under that, they are 4-7 ATS.


Rick Barnes is 24-38 (38.7%) against the spread in the NCAA Tournament in his coaching career with Providence, Clemson, Texas and Tennessee. That includes a record of 7-19 ATS in the tournament since 2010. Of the 314 coaches in that span, Barnes is the least profitable on a $100 wager at -$1,245. Barnes hasn’t finished a single NCAA Tournament above .500 ATS since 2009 — 12 straight tournaments .500 ATS or worse.
As an underdog or a favorite of under 10 pts (not a double-digit favorite), Barnes is 4-16 ATS in the NCAA Tournament since 2009-10.
Rick Barnes Unders With Low Totals Since 2005
6-1 under — 130 or less
12-5 under — 135 or less


Northern Iowa is back in the dance for the first time since 2016. Panthers historically have been a tough out. They’ve won their Round 64 game outright in three straight trips and in 13 NCAA Tournament games, Northern Iowa is 10-3 ATS, including 7-1 ATS in the Round of 64.
Rick Pitino is 18-5 SU in the Round of 64 as a head coach — when Pitino’s teams are a favorite in that Round of 64 game, they are 17-2 SU and 11-8 ATS.


Between his days at Southern Illinois and Purdue, Matt Painter has coached 17 Round of 64 games — his teams are 13-4 ATS (77%) in that round. His 77% ATS win pct in the Round of 64 is the highest mark for any head coach with a minimum of 10 games coached. Painter has also had success as a favorite, going 16-8 ATS in the tourney.
Prudue has been an under machine in the NCAA Tournament recently under Matt Painter. Since 2021-22, Purdue is 11-2 to the under in the dance, best mark of any school in that span, including 4-0 to the under in the Round of 64.
Queens University makes their first appearance in the NCAA Tournament. This season, Queens is 4-12 SU and 3-13 ATS over the full game spread when trailing at the half.
Over the last two seasons, Cal Baptist is 42-23 SU, winning almost 65% of their games — but not great as an underdog, going 2-14 SU as a dog of 3+ pts and 1-11 SU as a dog of 6+ pts in that span.
Over the last seven NCAA Tournaments, Bill Self is 7-13 ATS, losing a $100 bettor $651, making him the least profitable coach in the tourney in that span of 202 coaches.
Self is 20-3 SU in the Round of 64 as a head coach since 2001 — the 3 losses came with his teams holding an Offensive Efficiency below 110 entering the tournament (12-0 at 110+ since 2002). This year, Kansas has an OE of just under that mark at 109.8.
Self is on a 4-game ATS losing streak in the NCAA Tournament, his longest since 2009-11 — Self has never lost 5 straight NCAA Tournament games ATS. Kansas last lost 5 straight tournament games ATS back in 1996-97.
Kansas lost to Houston in the Big 12 conference tournament — dating back to 2017, KU is 2-8 ATS in their last ten NCAAT games as an at-large bid.

Dan Hurley is the NCAA Tourney cover king. Hurley is 17-3 ATS (85%) in the NCAA Tournament as a head coach, which is the highest ATS win percentage for a coach (min. 10 games) in the seeding era since 1979.
Dating back to the 2008-09 NCAA Tournament, the Huskies are 30-6 ATS in the dance, including 11-0 ATS as a favorite of 7 pts or more in the tournament since that 2009 date, with Hurley 8-0 ATS in the NCAA Tournament as a favorite of 7+ pts.
Bob Richey and Furman are back in the dance. He’s coached ten games with Furman in March where they are listed as the underdog. Furman is 6-4 SU, 7-3 ATS and the over is 7-3 in those games.

Coaching Notes
Dating back to 1978, the start of the seeding era in the NCAA Tournament, here is an ATS search-based database of every head coach. Search for a name and enjoy.
Here is a breakdown of the best and worst ATS win percentages for active coaches in this year's NCAA Tournament (minimum 10 NCAAT games, since 1978):

Best ATS Win Pct
Dan Hurley
17-3 ATS
Hubert Davis
9-2 ATS
Andy Enfield
10-3 ATS
John Groce
7-3 ATS
Matt Painter
27-14 ATS

Worst ATS Win Pct
Tommy Lloyd
3-7 ATS
Randy Bennett
6-12 ATS
Jamie Dixon
10-19 ATS
Kevin Willard
4-7 ATS
Rick Barnes
24-38 ATS
Now, let's look at a few superlatives for different head coaches in the NCAA Tournament. Tap the tables below to reveal lists for each category.
List A: Best and worst active head coaches ATS as a favorite (min. 10 games, since 1978)
List B: Best and worst active head coaches ATS as an underdog (min. 7 games, since 1978)
List C: Best and worst active head coaches ATS in Round of 32 and 64 (min. 10 games, since 1985)
A. The ATS Favorites List
The Best | The Worst | ||
| 1. | Dan Hurley, UConn: 15-2 ATS | Jamie Dixon, TCU: 6-16 ATS | |
| 2. | Matt Painter, Purdue: 17-8 ATS | Rick Barnes, Tenn.: 20-30 ATS | |
| 3. | Tom Izzo, Mich. St: 32-20-2 ATS | Mark Few, Gonzaga: 19-26-1 ATS | |
| 4. | Jon Scheyer, Duke: 6-4 ATS | Mick Cronin, UCLA: 8-9 ATS | |
| 5. | Rick Pitino, St. John's: 34-25-1 ATS | John Calipari, Arkansas: 35-32-2 ATS | |
| Updated as of March, 16th (Min. 10 games) | |||
B. The ATS Underdogs List
The Best | The Worst | ||
| 1. | John Calipari, Arkansas: 9-3-1 ATS | Randy Benett, St. Mary's: 2-8 ATS | |
| 2. | Andy Enfield, SMU: 6-2 ATS | Rick Barnes, Tenn.: 4-8 ATS | |
| 3. | Sean Miller, Texas: 8-4 ATS | Nate Oats, Alabama: 3-4 ATS | |
| 4. | John Groce, Akron: 6-3 ATS | Bill Self, Kansas: 7-8 ATS | |
| 5. | Matt Painter, Purdue: 10-6 ATS | Tom Izzo, Mich. St: 15-16 ATS | |
| Updated as of March, 16th (Min. 7 games) | |||
C. The ATS First Weekend List
The Best | The Worst | ||
| 1. | Andy Enfield, SMU: 8-2 ATS | Randy Benett, St. Mary's: 6-11 ATS | |
| 2. | Matt Painter, Purdue: 22-7 ATS | Rick Barnes, Tenn.: 18-28 ATS | |
| 3. | Dan Hurley, UConn: 9-3 ATS | Jamie Dixon, TCU: 10-15 ATS | |
| 4. | Sean Miller, Texas: 14-7-2 ATS | Kevin Willard, Villanova: 4-6 ATS | |
| 5. | Brad Brownell, Clemson: 6-4-1 ATS | Fran McCaffery, Penn: 8-10 ATS | |
| Updated as of March, 16th (Min. 10 games) | |||

Bet Labs Systems
Let's take a look at some NCAA Tournament systems. Click each system for matches, bets and detailed profitability charts.
Notes: This system targets undervalued teams coming off a good defensive performance. The system is .500 ATS or better in the last 7 NCAA Tournaments.
Current matches: USF, Siena
Notes: The old notion, "Fade The Public." This system targets under-bet teams in high-bet games. For this, we are using 1.1X daily bet average. If you have Bet Labs, increase that DB-AVG for smaller sample, higher ROI matches.
Current matches: Check updated betting lines
Notes: Free-throw shooting in the tournament is key. This system targets the better shooting teams vs. the teams shooting under 75%.
Current matches: Akron, Houston, Illinois, Iowa, Kansas, Louisville, Michigan State, Ohio State, Siena, Tenn. State, UCLA, Wright State
Notes: In the NCAA Tournament, it's been all about first-half Unders. Since 2017, 1H unders in First Four and Round of 64 are 137-111-3 (55.2%) and the unders are .500 or better in every round except for the Round of 32.

Slow It Down
Look for first-half Unders in the NCAA Tournament between slower-paced teams.
Current matches: Iowa/Clemson, Furman/UConn, Siena/Duke, Cal Baptist/KU, Missouri/Miami, N. Dakota St/Mich. State, VCU/UNC, Utah State/Villanova
Speaking of pace. When a higher-paced team for the season faces a lower-paced team during the tournament, historically, the slower-paced team has had the advantage covering the spread, especially in the early rounds.
Current matches: 18 total matches. Howard and Prairie View A&M in First Four.

Over! Look Under.
When two teams that are both over .500 to the over during their season entering the NCAA Tournament, meet, the total being inflated and the under hitting has been a good strategy.
Current matches: Texas/NC State, SMU/Miami (OH), Villanova/Utah State

Buyer Beware
Teams to win by 20+ points in the Round of 64 are 82-33 straight up, but just 49-64-2 ATS in the Round of 32 when their opponent won by less than 20 points in the Round of 64 since 2005.

Bounceback
Teams entering the NCAA Tournament off a loss of 20+ points are 28-14-1 ATS in the Round of 64 since 2005.
Current matches: Texas A&M, Texas Tech, UCF, KU, UConn, Miami

Hold The Ball
Don’t turn over the ball. Tourney teams that average a low number of turnovers have success as underdogs in the first half of the Round of 64.
1H dogs averaging 11 TO or fewer on the year are 88-61-2 1H ATS (58.2%) in the Round of 64 since 2011, finishing above .500 ATS in nine straight NCAA Tournaments.
Current matches: 17 total matches. McNeese State, Clemson, Northern Iowa and Villanova have lowest TO's of group.

Historical Public Betting
When looking strictly at game-to-game spread betting percentages from our Action Labs software — which is available for every game across 10+ sports — here are some notes about public betting patterns:
How do popular underdogs perform in the NCAA Tournament?
In the Round of 64, underdogs receiving the majority of the ticket count are basically .500 ATS at 87-90-2 ATS since 2005, but in the Round of 32, they are 39-54-1 ATS, the worst mark of any round in the tourney.
How has the public performed overall in March Madness?
Two years ago, the public had their best March Madness by far. Teams with more than 50% of the spread bets or tickets went 45-21 ATS (68%) in 2024. A $100 bettor was up $2,003 for a 30.4% ROI. 2025 saw a reversal to more of a normal mark. The public went 27-38 ATS (42%) with a $100 bettor losing $1,326 for a -20.4% ROI. Overall, the betting public has been .500 ATS or below in eight of the previous 13 seasons.
What have we learned about public betting and over/unders?
The public tends to do a better job at accurately predicting Unders in the NCAA Tournament than Overs. Here are the public betting results for Overs and Unders in the past seven tournaments (since 2017-18):
When Overs are the public side (51%+ of tickets on the over): 143-176-4 (45%) to the Over — going under the total by 0.9 PPG
When Unders are the public side (51%+ of tickets on the under): 77-57-1 (58%) to the Under — going under the total by 1.2 PPG
Should you avoid massive public sides?
Since 2005, only 13 different teams have closed with at least 80% of the spread bets in the NCAA Tournament. Those 13 teams are 2-11 ATS. When you lower it to 75%+, those sides are 31-44-2 ATS in March Madness.
Biggest Public Sides in NCAA Tournament Since 2005 (0-8 ATS)
| Team | Matchup (ET) | Year/Result |
|---|---|---|
| Oregon (-8.5) vs. Miami-Ohio | 2007, Round of 64 Oregon (89%) | ORE, 58-56 | |
| Louisville (-21.5) vs. Morehead State | 2009, Round of 64 Louisville (87%) | UL, 74-54 | |
| Oklahoma (-14.5) vs. Cal State Bakersfield | 2016, Round of 64 Oklahoma (85%) | OU, 82-68 | |
| Tennessee (-19) vs. American | 2008, Round of 64 Tennessee (85%) | TENN, 72-57 | |
| Memphis (-20) vs. Cal State Northridge | 2009, Round of 64 Memphis (84%) | MEM, 81-70 | |
| Duke (-20.5) vs. Albany | 2013, Round of 64 Duke (83%) | Duke, 73-61 | |
| Memphis (-26) vs. UT Arlington | 2008, Round of 64 Memphis (83%) | MEM, 87-63 | |
| Michigan State (-5) vs. George Mason | 2006, Round of 64 Michigan St. (82%) | George Mason, 75-65 | |

March Madness Trends
Let's take a live look at the biggest line movements for the Round of 64.

Biggest Spread Moves
Northern Iowa 2-pt move: +11.5 to +9.5 vs. St. John's
Hofstra 2-pt move: +13.5 to +11.5 vs. Alabama
UConn 2-pt move: -18.5 to -20.5 vs. Furman
Purdue 2-pt move: -23.5 to -25.5 vs. Queens

Rising Totals
Cal Baptist/Kansas 5-pt move: 134.5 to 139.5
Wright State/Virginia 2-pt move: 144.5 to 146.5
Falling Totals
LIU/Arizona 5-pt move: 152.5 to 147.5
Queens/Purdue 5-pt move: 165.5 to 160.5
Santa Clara/Kentucky 4.5-pt move: 161.5 to 157
Missouri/Miami 4-pt move: 150.5 to 146.5

Dog Hunting
Favorites have dominated the NCAA Tournament recently. In the last two tournaments, favorites are 76-58 ATS (56.7%), covering the spread by 1.5 PPG, with a $100 bettor up 8.6% ROI at +$1,148 — the best two-year stretch for favorites ATS since 2008-09.
In that span, favorites of 6+ pts are 46-25 ATS (+$1,712, +24% ROI) and favorites of 8+ pts are 32-14 ATS (+$1,520, +33% ROI).
Let's Talk Elevation
Using Bet Labs, we've identified 16 schools playing at the highest elevation in the country during the season. Since 2005, those teams are 32-69-1 ATS (32%) in the NCAA Tournament. They've finished above .500 ATS as a group of schools just once since 2005.
Current matches: Utah State

A Different Class
Since the 2013 NCAA Tournament, we've had 25 teams play in the Round of 64 on 3 total days rest or less as a favorite and face a team on 4+ days rest on the other side.
An example would be Wisconsin vs. Montana in 2024. The Badgers lost in the Big Ten title game on Sunday and played Montana on Thursday. Montana last played eight days prior on Wednesday.
Those 25 teams are 23-2 SU and 16-8-1 ATS in that span — the good team, without a massive layoff.
Current matches: Vanderbilt and Arkansas

Back To Normal
Fade The Public
In 2024, the public had its best March Madness in over two decades. Teams with more than 50% of the spread bets (or tickets) went 45-21 ATS (68%) with a $100 bettor up $2,003 for a 30.4% ROI.
2025 saw a reversal to more of a normal mark. The public went 27-38 ATS (42%) with a $100 bettor losing $1,326 for a -20.4% ROI. Overall, the betting public has been .500 ATS or below in eight of the previous 13 seasons.
Since 2005, only 13 different teams have closed with at least 80% of the spread bets in the NCAA Tournament. Those 13 teams are 2-11 ATS. When you lower it to 75%+, those sides are 31-44-2 ATS in March Madness.
West to East
UCLA in Philly
UCLA faces UCF in Philadelphia on Friday in the Round of 64. Teams based on Pacific Standard Time are 16-9 ATS playing in the Round of 64 in the EST dating back to 2013 and 11-6 ATS dating back to 2021.

High Spread, Low Totals
NCAA Tournament teams with a big spread tend to go over the total, the lower the over/under in the game is.
Since the 2014 tourney, favorites of 15+ pts with a total of…
150 or less: 38-25-1 to over (15.5% ROI)
140 or less: 27-12 to over (33.1% ROI)
135 or less: 22-8 to over (41.2% ROI)
Current matches: Houston/Idaho, Duke/Siena, UConn/Furman — more as well for different filter levels.

Let's Talk Seeding
We'll start with the 8 vs. 9 battle. 8-seeds are 77-83 SU, 72-84-4 ATS vs. 9-seeds in the Round 64 since 1985. It's the Round of 32 where you see the difference.
➤Round of 32 Results: 8-seeds in R32: 19-75 SU | 9-seeds in R32: 10-81 SU.

11 Is The New 12
Of teams seeded 10th or higher in the NCAA Tournament, the 11 seed is the only one above .500 on the moneyline since 2010 in the Round of 64. 11 seeds have been profitable on the moneyline in the Round of 64 in 14 of the last 19 tournaments.
Double The Fun
One double-digit seed has reached every Sweet 16 since 2008, and at least one 10-seed has at least one win vs. a seven-seed in 30the of last 31 NCAA Tournaments, including 43 of 46 tournaments since seeding began.
We've had exactly one in each of the last three tournaments:
2025: Arkansas (10)
2024: NC State (11)
2023: Princeton (15)
Look At Pace
Dogs Run Faster
Looking for a way to identify a Round of 64 double-digit seed to pull the upset? Let’s look at seeds 11 through 16 since 2005.
Pace of play is an interesting start. A slower-paced team — bottom 3rd in the country, 67 possessions or less — wins just 23% of R64 games, -13% ROI SU.
Over that pace mark, they win 24.2% of games, for a +16% ROI. If you add in lower totals, these higher paced teams have had Round 64 success.
(The team's pace for the current season. Pace is measured as possessions per 48 minutes in the NBA, possessions per 40 minutes in NCAAB. The higher the number, the faster the team's tempo is.)
Current matches: Cal Baptist, Furman, Idaho, North Dakota State, Penn, Tenn. State, Troy, Wright State

Tough Start
Florida Broke Streak
Round of 64: Florida (-28.5) beat Norfolk State, 95-69
Round of 32: Florida (-9.5) beat UConn, 77-75
Prior to the Florida Gators last year, the only other team since 1985 to start an NCAA Tournament 0-2 ATS and go on to win it all was Arizona back in 1997.

Key Dogs
Facing Bad Defenses
Underdogs in the Round of 64 tend to have a better time pulling the upset facing bad defensive teams. When dogs face teams in Round of 64 with a Defensive Efficiency of 95 or more, where they are both on a week rest or less, they win 34% of games for a +29% ROI. A $100 bettor would be up over $3,500.
Current matches: Cal Baptist, Hawaii, Penn, St. Louis, USF, TCU, VCU

How To Bet First Four
Here is what you need to know all about the First Four:
➤ The "First Four" began back in 2011. There have been 112 "First Four" teams and 56 winners.
➤ Entering 2026, 28 of those 56 winners were 16-seeds, while 28 were non-16-seeds.
➤ 27 of those 28 teams seeded 16th lost in the Round of 64, with Fairleigh Dickinson beating Purdue as the lone exception.
Here is how those 28 non-16-seeds performed in the NCAA Tournament:
17 lost in the Round of 64
6 lost in the Round of 32
3 lost in the Sweet 16
2 lost in the Final Four (2021 UCLA, 2011 VCU)
➤ Is there anything actionable we can take away from the 12 First Four teams (all seeds) to advance past the Round of 64?
10 of 12 Round of 64 games had spreads under 7 points
10 of 12 teams faced an opponent in the Round of 64 that was an at-large bid
10 of 12 Round of 64 games went under the total
9 of 12 were 11-seeds (2024 Colorado, 2013 La Salle, 2023 Fairleigh Dickinson being the exceptions)
9 of 12 teams entered the NCAA Tournament top 50 in RPI
8 of 12 teams had Round of 64 games with over/unders below 140
7 of 12 teams won their Round of 64 game by double-digits
➤A First Four team has advanced to the Round of 32 in 12 of 14 years, including advancing to the Sweet 16 in five of 14 years. Last year, all First Four teams lost in the Round of 64 for the first time since 2019.
➤Since the inception of the First Four in 2011, the public is 23-32 ATS in that round. The public has finished .500 ATS or below in the First Four in 10 of the 14 tournaments.

Upsets and Betting Records
Heading into March Madness, here are the biggest upsets in the tournament and the betting records set throughout the years.
What is the biggest NCAA Tournament favorite?
In the seeding era, 1999 Duke takes the cake when it was a 46-point favorite against Florida A&M. The Blue Devils beat the Rattlers 99-58, failing to cover the lofty 46-point spread by five points.
Only three teams have closed as a favorite of 35 points or more dating back to 1978, and none since 1999 (all listed below). But recently, we've seen some big favorites in the NCAA Tournament. Since 2005, we've had eight favorites of 28+ points in the NCAA Tournament — four came last year in 2025.
Biggest Favorites in NCAA Tournament Since 1978:
| Team | Matchup (ET) | Year/Result |
|---|---|---|
| Duke (-46) vs. Florida A&M | 1999, Round of 64 Duke, 99-58 | |
| Kansas (-36.5) vs. Prairie View A&M | 1998, Round of 64 Kansas, 110-52 | |
| Kansas (-35.5) vs. Jackson State | 1997, Round of 64 Kansas, 78-64 | |
What are the highest & lowest totals in the NCAA Tournament?
The last two years of the NCAA Tournament have changed the game when it comes to totals — and it's all Alabama's fault.
Since the 1996 tournament, we've had five games with a total of 170+, and all five included the Crimson Tide over the last two seasons (2024 and 2025 tournaments):
Alabama Last 2 Tournaments
In Alabama's nine NCAA Tournament games in 2024 and 2025, they went 5-4 to the over, but they are 5-2 to the over with a total of 162 or higher and 4-2 to the over at 165 or higher. Here are the highest totals in the last 30 years of the NCAA Tournament: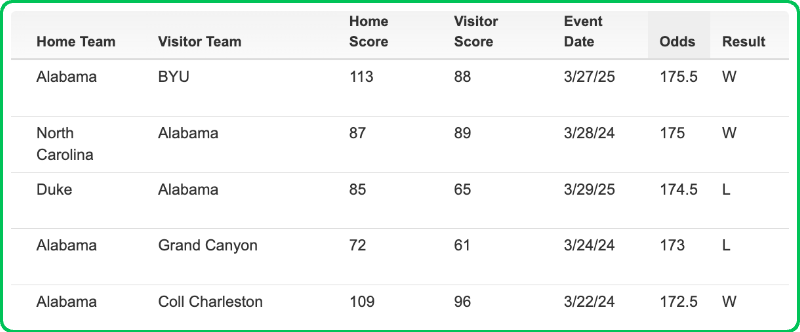
Prior to Alabama's 2024 and 2025 campaigns, we had only seen two totals since 1995 reach above the 170 mark in the NCAA Tournament, and those came all the way back in 1995, both with Texas involved.
Maryland vs. Texas
O/U: 177
Oregon vs. Texas
O/U: 176
➤In the 1995 tourney, the Texas Longhorns, behind coach Tommy Penders, were averaging almost 93 points per game and had back-to-back games with a total above 170. They faced Oregon in the Round of 64 and won, then the total got a little higher when they faced an even higher-scoring team in Maryland, a game in which the Longhorns lost by 14. Both games went under the total.

Lowest of Low
When it comes to the lowest totals, we've only seen one close below 110, and that came in 1996 between Princeton and Mississippi State. If we lift the floor a bit, we've only seen two totals close at 115 or lower since the 2010 NCAA Tournament — Northern Iowa/Wyoming in 2015 (110.5) and Cal/South Florida in 2012 (114).
Princeton vs. Mississippi State
O/U: 108
➤The story of this over/under tale is Princeton's defense, which was No. 1 in the country in 1995-96 and allowed under 52 points per game. As a 13-seed in the Round of 64, the Tigers beat 4-seed UCLA, 43-41, and held the Bruins to 38.5% shooting (Princeton shot 37% and won). Then, in the Round of 32, the total closed at 108 vs. Mississippi State, which beat Princeton, 63-41, barely staying under the total.
In the new era of college basketball from a betting perspective, since PASPA was repealed in May of 2018, unders are 222-175-4 (55.9%) in the NCAA Tournament. Unders are .500 or better in each of the six tournaments in that span: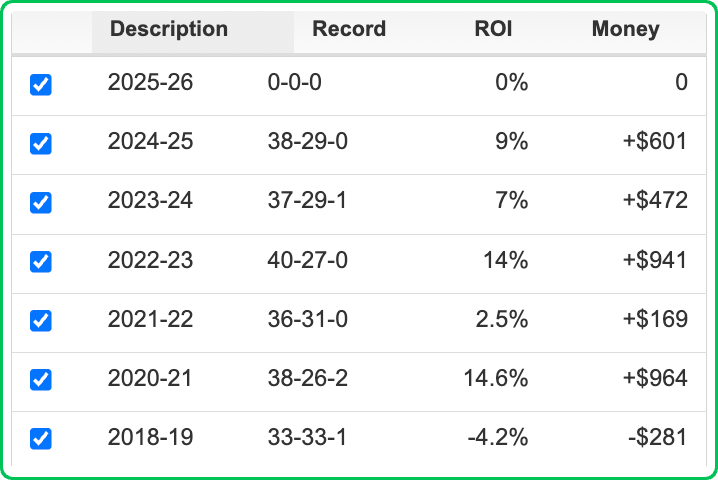
In that span, we've had four totals below 120 points, and they all came back in the 2019 NCAA Tournament: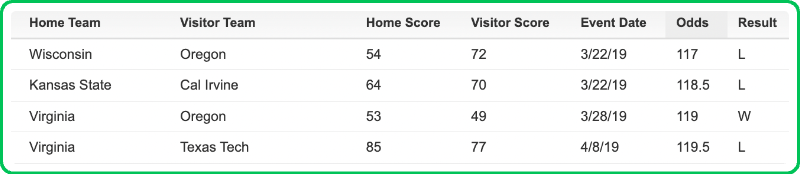
The lowest total since then was Virginia and Colorado State in 2024 and San Diego State and Creighton in 2022, both with a total of 121.
What are the easiest betting wins in the NCAA Tournament?
Between the moneyline, against the spread and totals, going through history, what have been the easiest (largest margin) wins for bettors? Let's explore.
Easiest Bets Won in NCAA Tournament…
| Teams | Year/Result | Bet Type (Record Since) |
|---|---|---|
| 2016 National Semifinals Villanova (-2.5) | VIL, 95-51 Covered by 41.5 pts | Against The Spread ('78) | |
 | 1998 Round of 64 Kansas (-36.5) | KU, 110-52 Won by 58 pts | Moneyline ('78) |
| 2002 Round of 32 Cincinnati/UCLA (139) | 105-101 Went over by 67 pts | Over ('95) | |
| 2017 Round of 64 S. Dakota St/Gonzaga (157.5) | 66-46 Went under by 45.5 pts | Under ('95) | |
What are the biggest betting upsets in the NCAA Tournament?
Since seeding began in 1978, eleven teams have lost straight up in the NCAA Tournament as a favorite of 15 points or more. Let's take a look at the eight who have lost at -17 or higher in that span:
2023
Purdue (-23.5) lost to Fairleigh Dickinson
2012
Missouri (-21) lost to Norfolk State
2018
Virginia (-20.5) lost to UMBC
1997
South Carolina (-18.5) lost to Coppin State
1993
Arizona (-18.5) lost to Santa Clara
2022
Kentucky (-17.5) lost to Saint Peter's
2001
Iowa State (-17.5) lost to Hampton
1986
Notre Dame (-17) lost to Arkansas-Little Rock
➤Since 1978, Kansas has had the most losses by any school as a double-digit favorite (6), but none since 2011. Arizona and Duke are second on that list with four losses as double-digit favorites each — Arizona's last loss came in 2023, while Duke's was back in 2014.
➤Perfect Trip: In that same timeframe, here are the teams with the most SU wins without a loss as a double-digit favorite: Louisville (16-0), Michigan (15-0), Syracuse (12-0), Arkansas (10-0), Maryland (10-0), and UNLV (10-0). Tennessee (9) and Cincinnati (9) are the next-closest teams.
What are the worst betting losses later in March Madness?
Since seeding began in 1978, seven teams have lost straight up in the Sweet 16 or later as a favorite of 10 points or more. Our last example of this came back in 2022 when both Purdue and Gonzaga lost in the same season. Let's take a look at the top seven losses.


