Miami (OH) vs Ohio Odds
| Miami (OH) Odds | ||
|---|---|---|
| Spread | Total | Moneyline |
+7 -105 | 39.5 -110o / -110u | +220 |
| Ohio Odds | ||
|---|---|---|
| Spread | Total | Moneyline |
-7 -115 | 39.5 -110o / -110u | -275 |
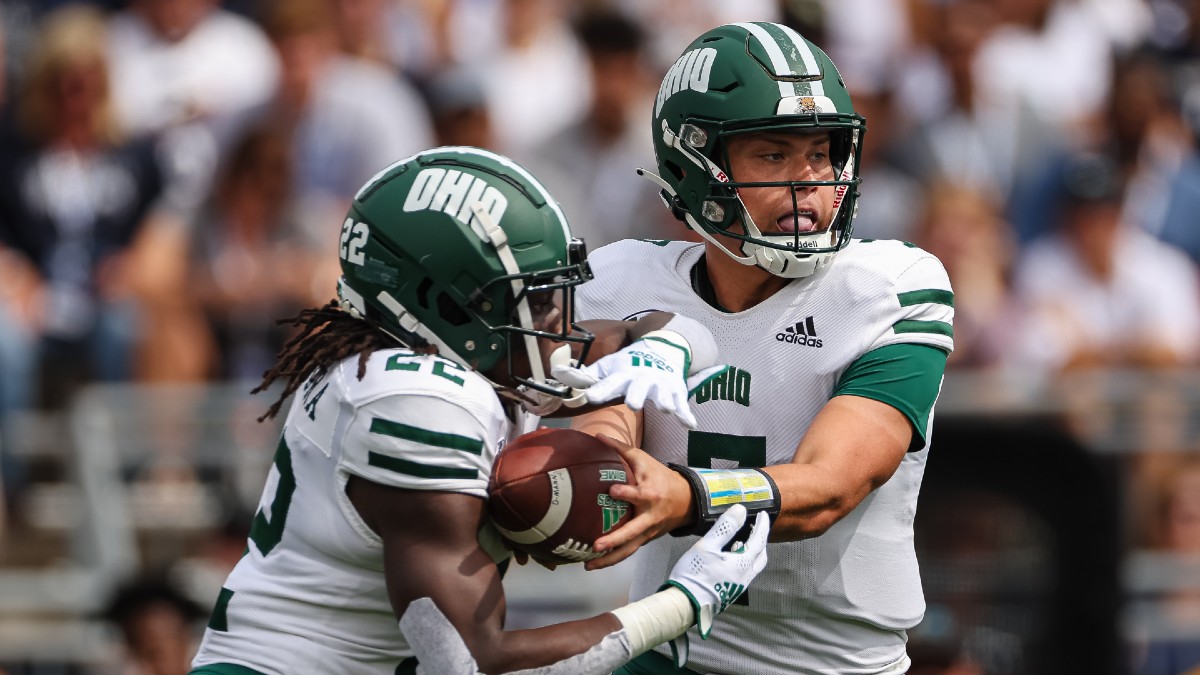
The battle for the top of the MAC East division will be on display when Miami travels to Athens, Ohio to take on the Ohio Bobcats.
Miami comes into this game with a 6-2 record, but looking to bounce back from a home loss to Toledo. The Redhawks are 6-2 against the spread and have gone over in four games this season.
Ohio enters this game with a 6-2 record and coming off of a home win over Western Michigan. The Rockets are 4-4 against the spread and have gone under in seven games.
It will be perfect weather at kickoff. Temperatures will range from 66 to 71 degrees. And with winds ranging from 2.7 to 3.5 miles per hour, there will be little impact to the offense and special teams play.
Chuck Martin's tenth season as Miami's head coach has arguably been his best yet with the program. His previous best season was eight wins in 2019. The RedHawks are averaging 29.8 points per game and 6.2 yards per play. The offense has a 42% success rate, allows a 17% havoc rate, and scores 4.41 points per opportunity. The offense ranks 122nd in pace at 30.3 seconds per play.
Miami ranks 100th in passing rate at 45%. The offense averages 24.9 pass attempts per game and 211.8 passing yards per game. The passing game had been Brett Gabbert who completed 59.4% of his passes for an average of 8.7 yards per attempt. Gabbert was injured last week and is expected to miss the remainder of the season. The more mobile Aveon Smith will lead the Miami offense for the remainder of the year. As a team, Miami has a 42% passing success rate and averages 3.0 passes over 20 yards per game.
Rashad Amos leads a Miami running game that averages 154.1 rushing yards per game. Amos has 98 rush attempts, 421 rushing yards, and four touchdowns. Gabbert is, or was, an integral part of the running game with 49 attempts for 140 yards and two scores. As a team, Miami has a 42% rushing success rate. The offensive line generates 3.2 line yards per attempt and allows a 14.6% stuff rate.
The RedHawks allow 19.4 points per game and 5.0 yards per attempt. Opponents have averaged a 41% success rate and 3.88 points per opportunity. Miami generates havoc on 17% of plays and allows more than three 20+ yard plays per game.
After a 10-4 second season as head coach, Tim Albin is putting together another strong season in year 3. The Bobcats are averaging 22.5 points per game and 5.1 yards per play. They have a 45% success rate and allow havoc on 15% of plays. One struggle for the Bobcats offense has been their inability to finish drives. They average just 3.38 points per opportunity.
The Bobcats rank 93rd in passing rate. They average 31.8 pass attempts per game and 206.9 passing yards per game. Kurtis Rourke has missed some time with injury this season, but is back leading the Ohio offense. He is completing 62.9% of his passes for an average of 6.9 yards per attempt. As a team, they have a 47% success rate and average 2.6 explosive passes per game
Ohio averages 142.1 rushing yards per game. The workload is split between Sieh Bangura and O'Shaan Allison who each have more than 100 rush attempts. Combined they have 794 rushing yards and four rushing touchdowns. As a unit, Ohio has a 44% rushing success rate. The offensive line generates 3.2 line yards per attempt and allows a 14.9% stuff rate.
Defense is the strength of this Ohio team, particularly against the run. As a team, they allow 13.9 points per game and 4.6 yards per play. They allow a 36% success rate, generate havoc on 21% of plays, and allow just 2.05 points per opportunity. They rank 18th nationally with a 35% rushing success rate allowed and they rank 11th with just 20 explosive plays allowed through eight games.
Toggle the dropdowns below to hide or show how Miami (OH) and Ohio match up statistically:
Miami (OH) Offense vs. Ohio Defense
 Offense |  Defense |  Edge | |
| Rush Success | 89 | 18 |  |
| Line Yards | 40 | 19 |  |
| Pass Success | 63 | 33 |  |
| Havoc | 35 | 5 |  |
| Finishing Drives | 35 | 2 |  |
| Quality Drives | 31 | 12 |  |
Ohio Offense vs. Miami (OH) Defense
 Offense |  Defense |  Edge | |
| Rush Success | 57 | 50 |  |
| Line Yards | 50 | 121 |  |
| Pass Success | 29 | 54 |  |
| Havoc | 55 | 32 |  |
| Finishing Drives | 102 | 84 |  |
| Quality Drives | 39 | 39 |  |
Pace of Play / Other
 |  | |
| PFF Tackling | 80 | 101 |
| PFF Coverage | 39 | 85 |
| Special Teams SP+ | 5 | 132 |
| Middle 8 | 95 | 43 |
| Seconds per Play | 30.3 (122) | 29.4 (111) |
| Rush Rate | 57.8% (35) | 53.8% (45) |

Miami (OH) vs Ohio
Betting Pick & Prediction
As of this writing, Ohio is a seven point favorite with the line moving up from the opening number of -6.5. Despite the movement, it appears that the sharps are backing the underdog with 59% of tickets and 76% of money on Miami.
In a low-scoring game, I typically back the underdog and that would be my lean, but it isn't my preferred play due to Miami's offense matching strength-on-strength with Ohio's defense.
Sharps are out in full force on the under. While only 40% of bets are on the under, a whopping 85% of the money is backing the under.
My preferred play is to back the under. Even at low total, this matchup dictates an even lower scoring game. Both teams play at a below average pace with a preference to run, particularly with the Gabbert injury, and the defense represents the strength for both teams.
What is QuickSlip?
QuickSlip is an Action Network feature that allows users to automatically pre-load their bet slip at FanDuel Sportsbook.


