It is officially time for the first Action Analytics preview of the year!
I like to give it a few weeks and let conference play settle in a bit before conducting these, as it gives the statistics a chance to normalize.
I'm excited to be conducting these in a year that looks absolutely wide open. The SEC is struggling, and the Pac-12 (RIP) is the bell of the ball with six ranked teams, five of which are undefeated. Plus, it has the greatest show on turf in Coach Prime's Colorado squad.
If you like parity, this is probably the best college football season for you since the start of the College Football Playoff.
This breakdown looks at three metrics that have proven to be relevant to covering the spread:
If you're interested in why these metrics have been chosen, check out this piece by Collin Wilson. To quote his findings:
“Data from the past five years indicates defensive Success Rate, Havoc and Finishing Drives are the biggest indicators in beating oddsmakers this college football season.”
Let’s dive in and see where we can find an edge in Week 5.
Havoc
What is Havoc?
Havoc is a college football term defined as a play where there’s an unexpected outcome. Pass breakups, forced fumbles and tackles for loss are just a few of the plays that cause chaos on any given Saturday. Collectively, these plays are used to build an identity for a team.
The calculation for Havoc is simply a cumulative number of tackles for loss, interceptions, fumbles and passes defensed divided by the number of plays on both sides of the ball.
Let's see where we can find some big Havoc discrepancies in Week 5:
Home Team Havoc Allowed vs. Away Team Havoc Rate
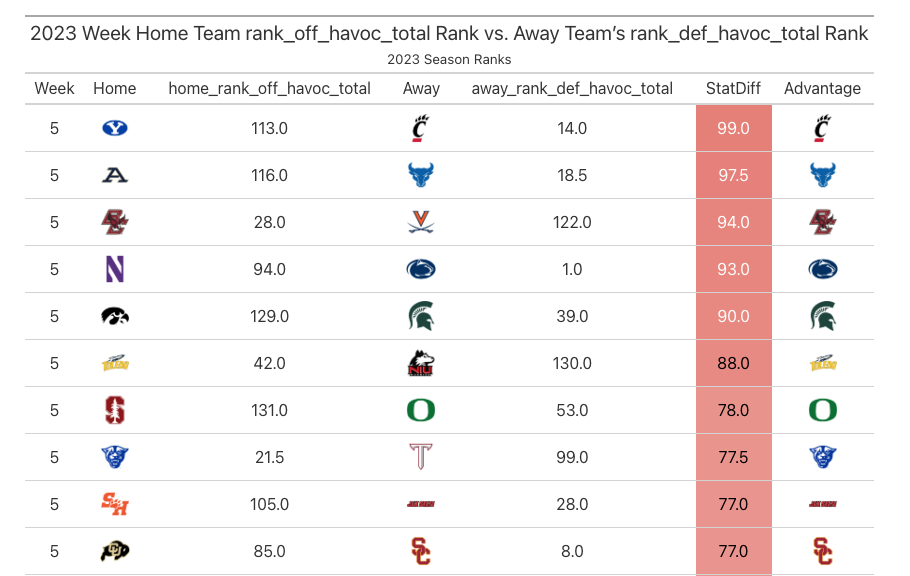
Top 3 Havoc Mismatches (Home Offense vs. Away Defense)
- Cincinnati Defense vs. BYU Offense
- Buffalo Defense vs. Akron Offense
- Boston College Offense vs. Virginia Defense
Away Team Havoc Allowed vs. Home Team Havoc Rate
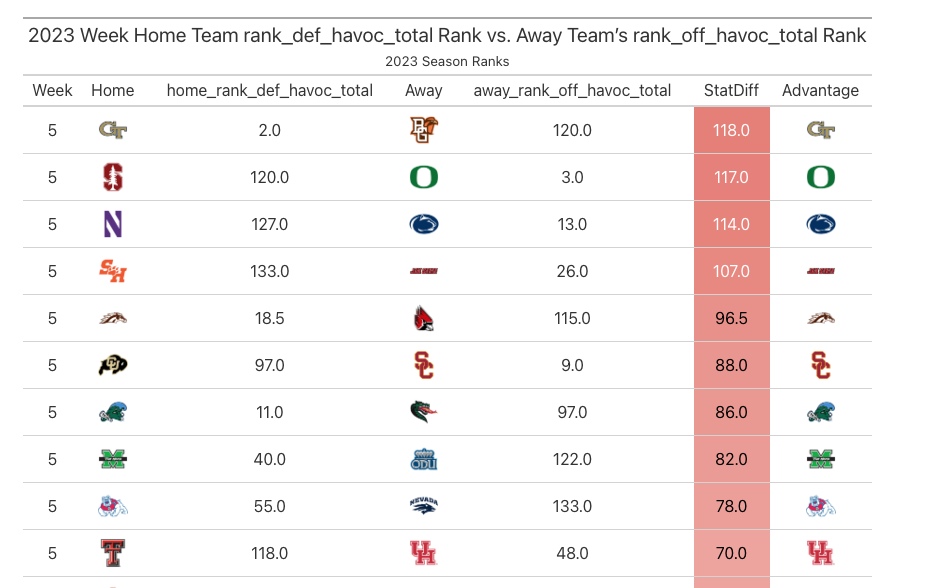
Top 3 Havoc Mismatches (Away Offense vs. Home Defense)
- Georgia Tech Defense vs. Bowling Green Offense
- Oregon Ducks Offense vs. Stanford Defense
- Penn State Offense vs. Northwestern Defense
Success Rate
What is Success Rate?
Success Rate is an advanced metric in football that measures efficiency but with the important context of down and distance considered.
A play is defined as successful if:
- It gains at least 50% of the yards required to move the chains on first down
- 70% of yards to gain on second down
- 100% of yards to gain on third or fourth down
To calculate Success Rate, simply divide the number of successful plays (as defined by down and distance above) by total plays.
This definition is taken from our article on Success Rate.
Home Team Offensive Success Rate vs. Away Team Defensive Success Rate
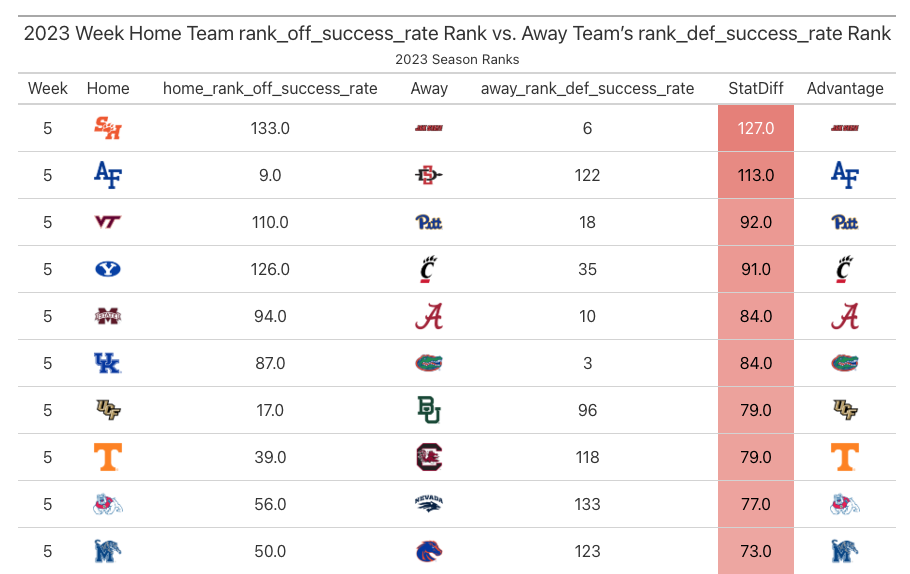
Top 3 Success Rate Mismatches (Home Offense vs. Away Defense)
- Jacksonville State Defense vs. Sam Houston State Offense
- Air Force Falcons Offense vs. San Diego State Defense
- Pitt Panthers Defense vs. Virginia Tech Offense
Away Team Offensive Success Rate vs. Home Team Defensive Success Rate
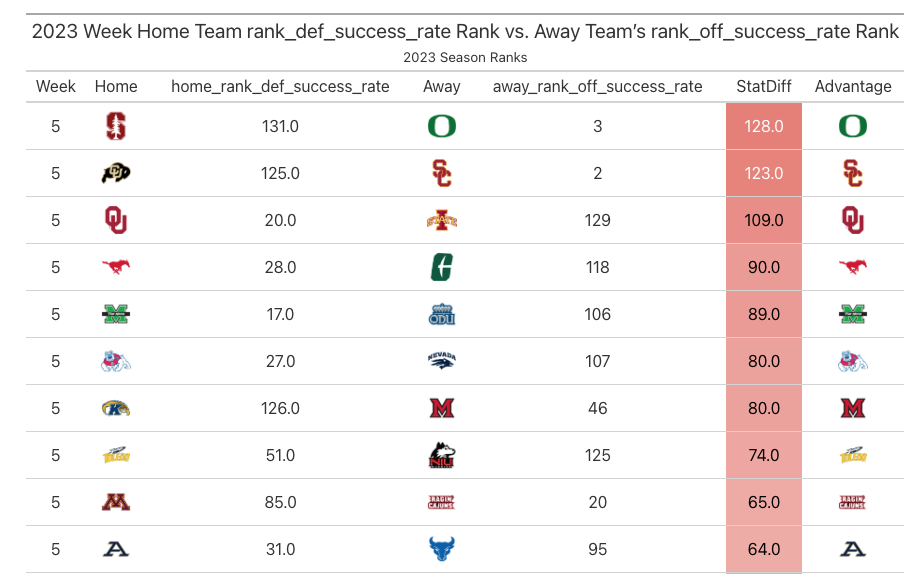
Top 3 Success Rate Mismatches (Away Offense vs. Home Defense)
- Oregon Offense vs. Stanford Defense
- USC Offense vs. Colorado Defense
- Oklahoma Defense vs. Iowa State Offense
Finishing Drives
What is Finishing Drives?
Finishing Drives is calculated as points per opportunity when the offense passes the opponent’s 40-yard line.
Defensively, this is how many Points per Opportunity a defense allows when the opposing offense crosses the 40-yard line.
Home Team Offensive Finishing Drives vs. Away Team Defensive Finishing Drives
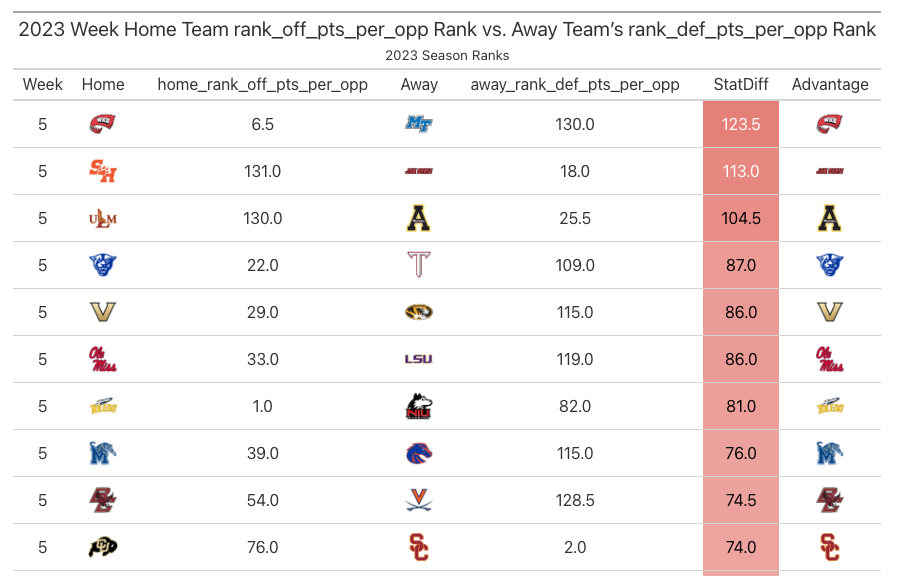
Top 3 Finishing Drives Mismatches (Home Offense vs. Away Defense)
- Western Kentucky Offense vs. Middle Tennessee State Defense
- Jacksonville State Defense vs. Sam Houston State Offense
- Appalachian State Defense vs. ULM Offense
Away Team Offensive Finishing Drives vs. Home Team Defensive Finishing Drives
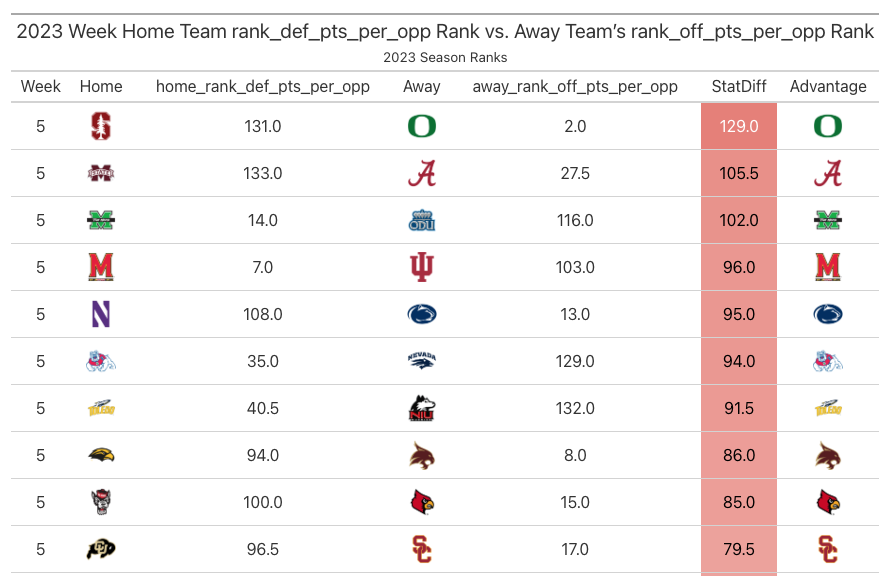
Top 3 Finishing Drives Mismatches (Away Offense vs. Home Defense)
- Oregon Offense vs. Stanford Defense
- Alabama Offense vs. Mississippi State Defense
- Marshall Defense vs. ODU Offense
College Football Week 5 Betting Takeaways
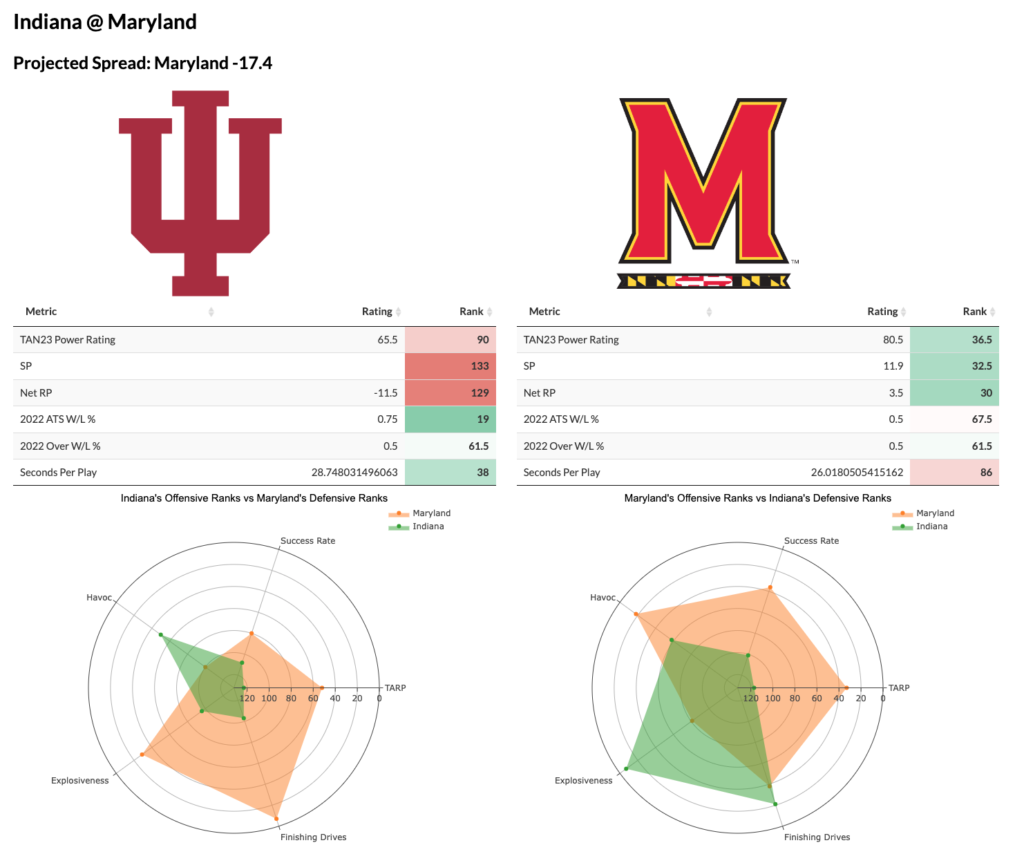
In the preseason, I remarked that I thought Maryland was a sleeper in the Big Ten and took its team total over and sprinkled in a little Big Ten champion action.
So far, the Terps have not disappointed, winning every game handily (it helps when the first two opponents are Towson and Charlotte) en route to a 4-0 record.
The Hoosiers will be one of their first real tests, but that defense is a disaster. Indiana ranks in the bottom 30 in Success Rate Allowed, explosiveness allowed and Points per Opportunity allowed.
This is going to be a huge problem against a Maryland team that has had a potent offense all season. The Terps' Success Rate numbers could be better (80th), but they rank in the top 10 in Points per Opportunity, meaning they should be scoring touchdowns instead of field goals this game.
All of the hype surrounding underdogs is in Boulder, Colorado, right now — but don't discount Maryland.
This offense is explosive, scores touchdowns instead of field goals and doesn't turn the ball over (third in turnovers). This is a great spot for Taulia Tagovailoa to put up a bunch of points.
Pick: Maryland Team Total Over 31.5 (-115)


