
2022 NHL Draft Preview & Analysis: Have Teams Improved at Drafting Over Time?

Bruce Bennett, Getty Images
I have posted a ton of NHL draft research over the past few months with a focus on trying to discover draft biases. Throughout my research I have found various metrics, that are correlated with success independent of draft position. For example, high-scoring players tend to outperform their draft position, while taller players tend to underperform their draft position.
The fact that these relationships persist shows NHL teams have failed to properly account for this information. A good question after finding these various draft biases is, do they still exist today? Unfortunately, nobody can say for sure. Only time will tell. Nevertheless, today we are going to try and test if the biases may still exist.
To do this, I will look at my sample to see if teams got better at accounting for this information. If teams were rapidly improving during my sample, it would strongly suggest that the inefficiencies I found are likely gone by now. If teams didn't get noticeably better at accounting for this information during my sample, it will make me incredibly skeptical of anyone arguing these biases are gone today. At least with a high degree of certainty.
NHL Draft Bias Index
To keep this post from being too long, we are going to look at all the biases I have found at the same time rather than individually. To do this, I am going to use an algorithm called Principal Component Analysis (PCA).
PCA is an algorithm used to make indices, which aim to show you how some numbers move together over time. It's usually used when some variables are highly related so you model them all at the same time. I put the big draft blind spots I found in a PCA.
For those who aren't sure what's going on don't worry. On their own, PCA results literally don't mean anything. It just shows you how some variables tend to move together. As a result, I will need to convince you that what I am using actually represents what I want to measure.
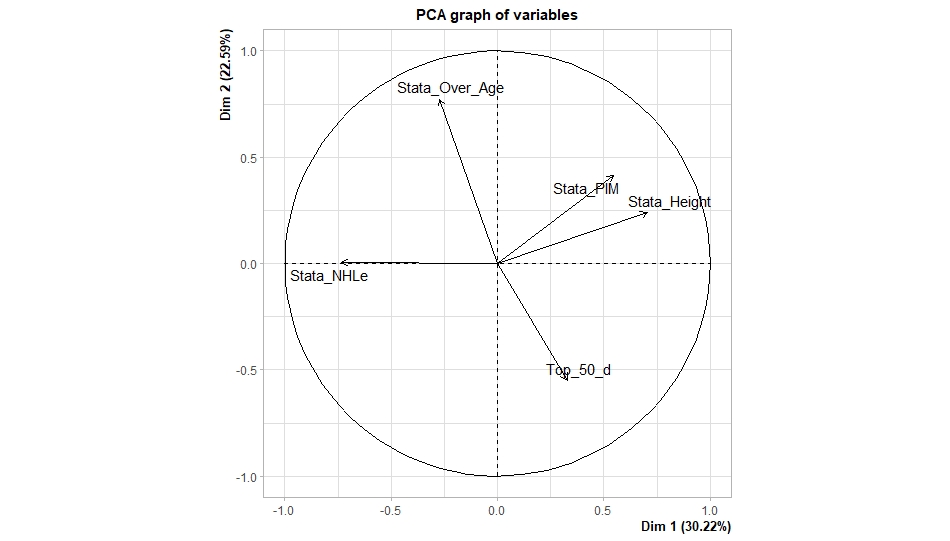
Focus on the first dimension (Dim 1) here. Dim 1 increases when the prospect is:
1) Taller
2) Takes more penalties
3) Is a defender drafted high
While the same dimension is decreasing when the prospect:
1) scores more
2) is an over-age prospect
Now, note the direction of the variables I have found to not be properly valued. I found high-scoring players do relatively well, and over-age players have also done relatively well. On the flip side, tall players do relatively worse, players who take a lot of penalties do relatively poorly, and finally, highly-drafted defenders tend to underperform.
Directionally, Dim 1 is decreasing when a player has characteristics that are associated with being undervalued, while the opposite is true for players shown to have been overvalued (technically they are all flipped but the direction doesn't matter, it just means negative represents player's likely to be undervalued instead of positive).
So, Dimension 1 is doing a reasonably good job at approximating all of the variables being examined. So, rather than looking at each metric individually, we use this Dim 1 variable to account for our under/overvalued characteristics at the same time.
Since it represents all our metrics at once, I am going to call this our NHL draft bias index.
NHL Draft Pick Success Rates
Now that we have one metric to represent a bunch of biases, we can test to see if the NHL Draft has been improving over time. To do this we need some way to quantify draft pick success.
Then, if the relationship between our draft bias index and draft success is shown to have been declining over time, the biases I have found are likely gone today.
To do this, I am going to be looking at success rates because they are less noise year to year. Success rates start from my NHL draft pick value curve.
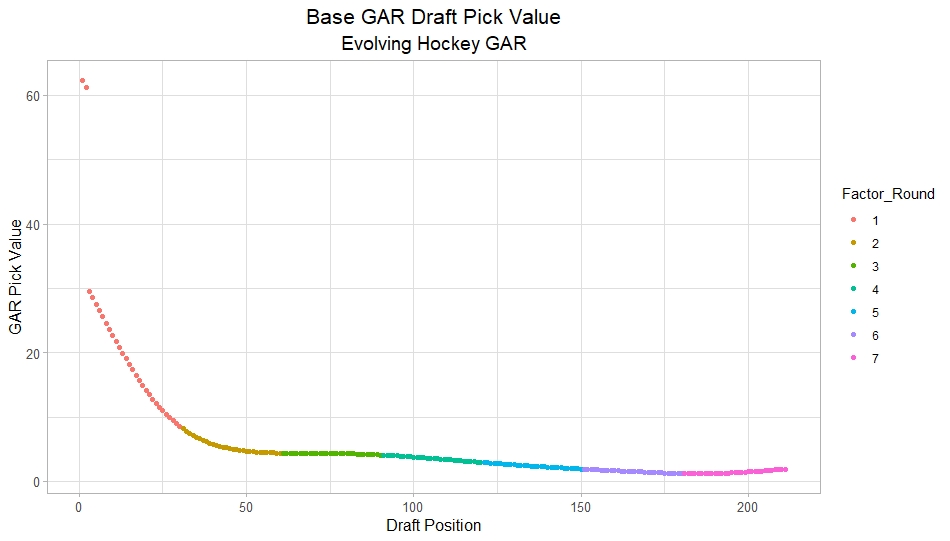
This chart shows how many Goals Above Replacement (GAR) a player is expected to produce based on their draft position. Then each player is given a 1 (success) or a 0 (failure). They get that 1 if they produced more value than expected based on their draft position, and a 0 otherwise.
Note that highly drafted players are more likely to get a 1 due to the heteroskedastic nature of the draft, and that will be accounted for in all the analyses below.
To do this, all the relationships below will include our draft bias index, draft position and draft position squared. Because draft position has been accounted for, if our bias index still predicts success, it will show that the NHL draft market failed to properly account for the information in our index.
NHL Draft Bias Index Over Time
While we know that NHL teams have failed to properly account for this information when looking at the sample as a whole, we are now going to try and answer a different question: Is the relationship between our index and success rates changing over time?
If the relationship between our index and Success Rates is trending towards 0 in our sample, it will show that NHL teams began adjusting and better accounting for this information. If the relationship is just random over time, it will show NHL teams didn't actually make any progress in accounting for these biases over nearly a decades worth of drafts.
What happens when examining the relationship over time? Well, there is a trend. Remember the undervalued players by our index are negative in this model. So numbers closer to -1 indicate the league was particularly poor at accounting for the biases in that year.
On the flip side, if the coefficient sits within error bars of zero, it means the league likely properly accounted for the biases we found in that draft. Here are the results.
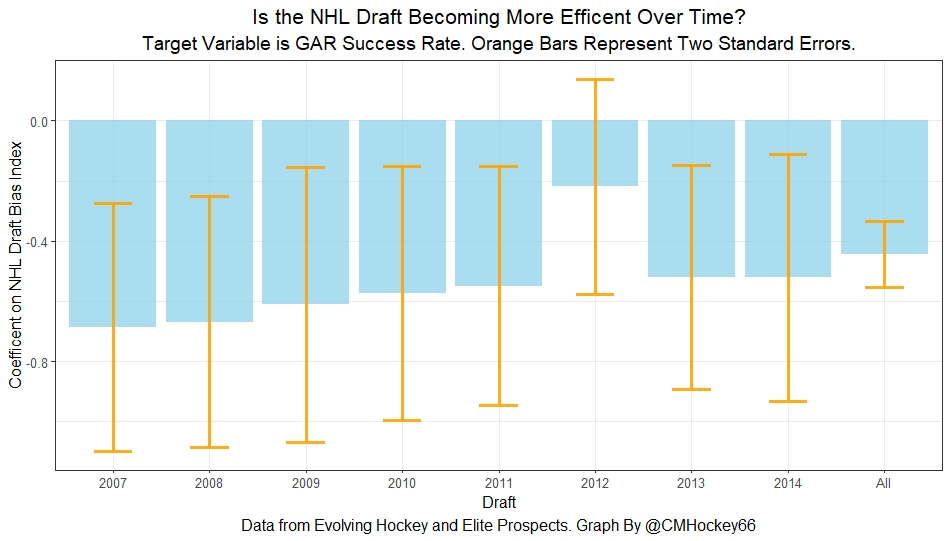
A few things pop out. First, get used to the trend where our NHL draft bias index did not predict success in 2012. Although given that 2012 is considered a historically bad draft for the league too, we can probably give the model a pass for that season. Weird stuff happens sometimes.
Beyond 2012, there is a trend. Altogether, as expected, players who have really small numbers in our NHL draft bias index were far more likely to be successful draft picks. We expected to see this though.
What's more important is the small trend showing the index did worse towards the end of the sample. Although, the cumulative point estimate is well within the range of each draft's error bars.
So, maybe the falling predictive power of our index isn't as meaningful as it may look. I have another reason to be skeptical that the decline you're seeing above is as big as it looks. Why? Because there's more than one way to define pick success. Using other metrics, the trend looks more cyclical than anything.
New Target Variables
The next metric up to define pick success is NHL games played. I applied the same draft pick value model, except this time used games played to arrive at the following curve.
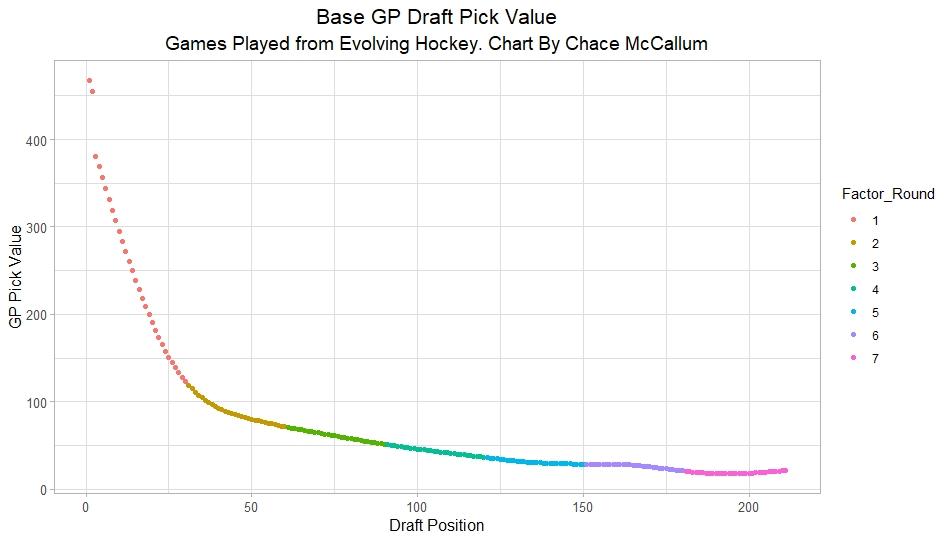
Then I repeated the same process to measure success rates. Did our bias index do noticeably worse at predicting success rates when using games played rather than GAR as our measure of prospect success? Not really.
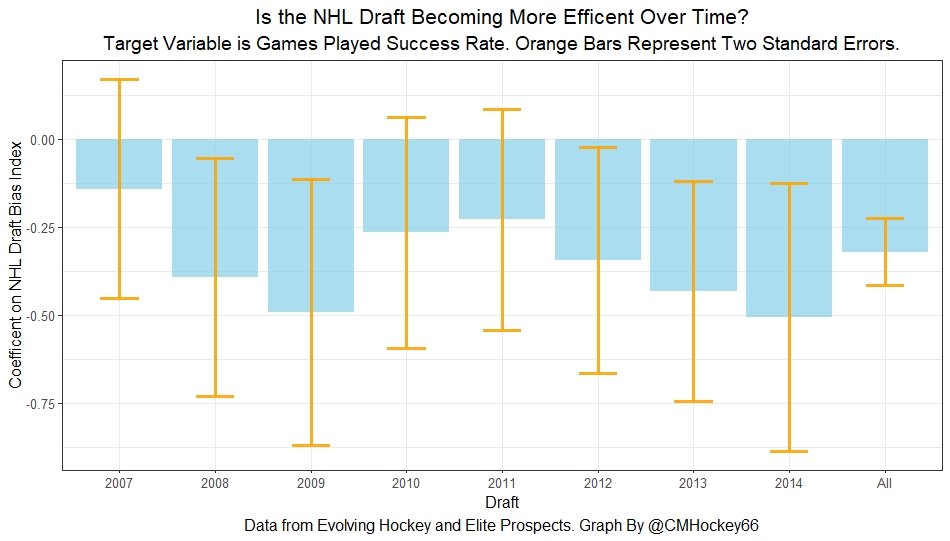
With a new target variable, the same general finding holds. Players who, based on our index, we believe are likely to be undervalued have generally outperformed their draft position.
Although this time when we look at the predictive power of our index against time, it just seems to be fluctuating randomly. In other words, did teams get worse at drafting, then better, then worse again? Probably not.
The trend above is more likely to be random variation. Of course, we can do this with more than just games played. This time let's use points to measure player output, applying the same pick value and success rate methodology as before.
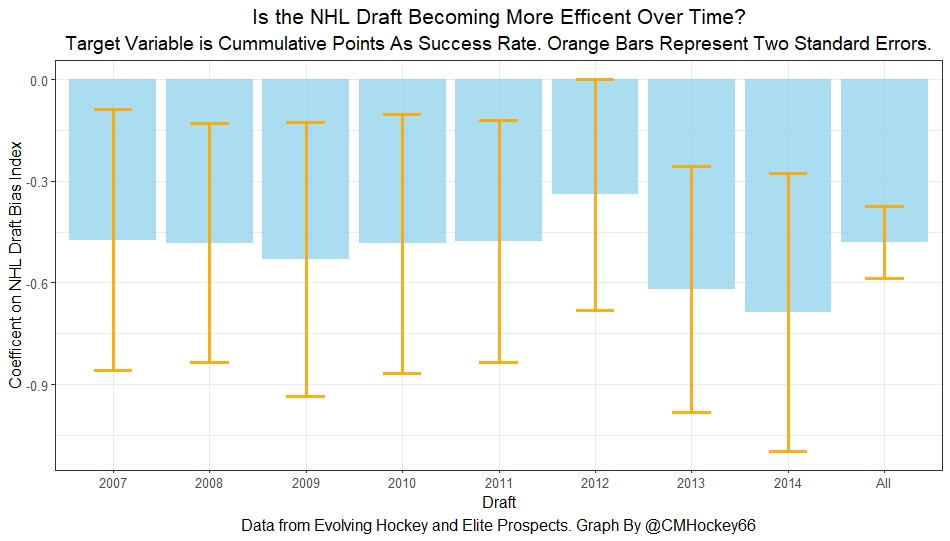
Aside from 2012, if anything, teams actually seem to have gotten worse at accounting for the biases over this sample. Again, it is important to respect the large error bars which will be present whenever looking at individual drafts. We are probably looking at 2012 as a weird year, then a bunch of random variations.
Next, we can even get better measures of success. This time I will attempt to account for opportunities given to players. This is important because if you look above you will notice our index did the worst job at finding inefficiencies when targeting games played.
In other words, when drafting, NHL teams are best at maximizing games played. Of the three variables above, games played are of course the variable NHL teams have the most control over. This is strong evidence of how much of a self-fulfilling prophecy the draft can be.
So, to better adjust for different levels of opportunity, let's look at GAR per game played to measure success. Note: Values have been regressed towards replacement level up until a player hit 82 games player.
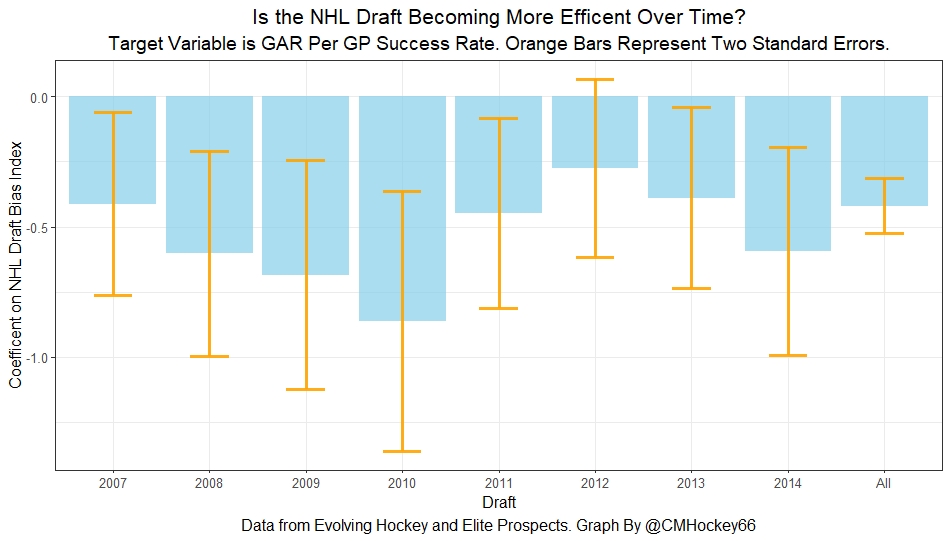
Again, I doubt teams got worse then better than worse. This is likely just more random variation, again with 2012 as an outlier.
Finally, let's do the same thing with GAR per minute played to evaluate draft pick success. This time, regressed towards replacement level up until 1500 minutes played.
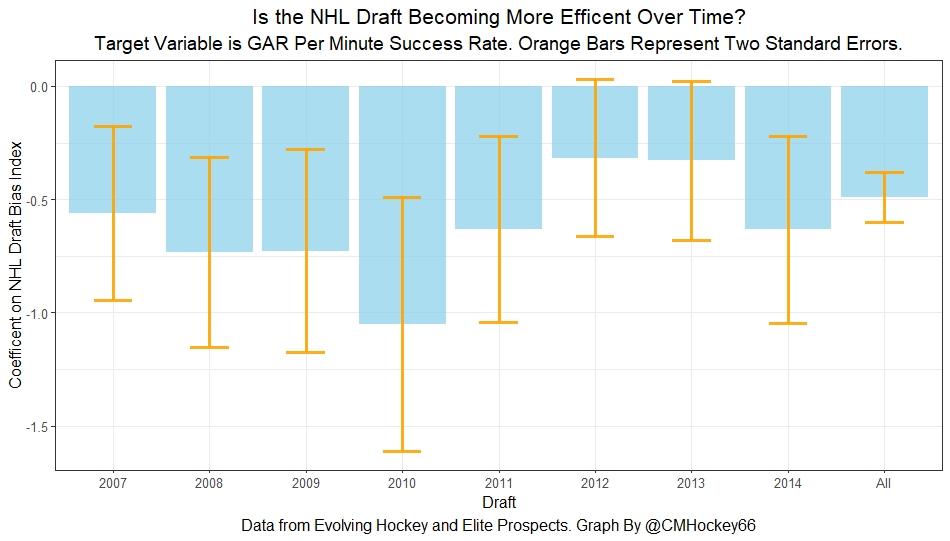
Again we are seeing a familiar cyclical-looking pattern. Here is the coefficient on our index graphed against time for each different target metric.
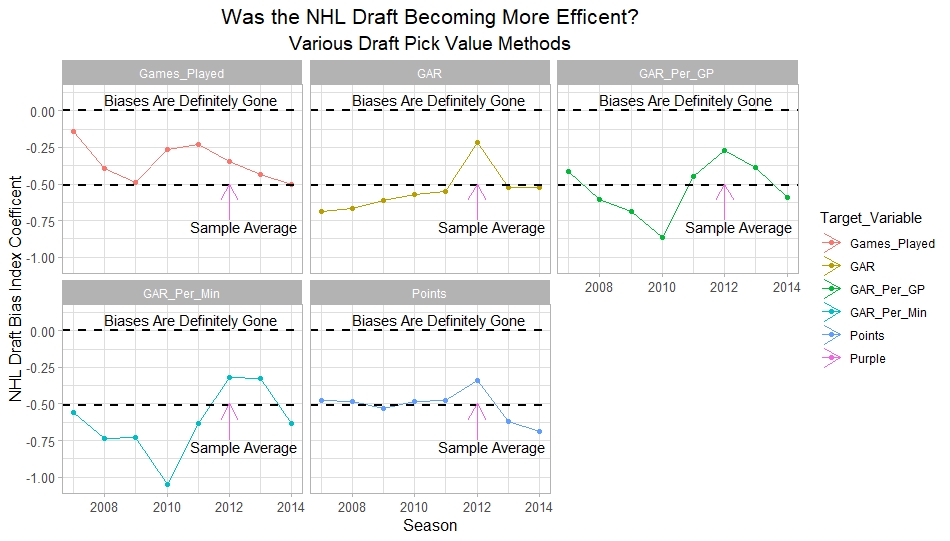
Remember, as these numbers trend towards 0 it means teams are getting better at accounting for their biases. Maybe there is a small trend of improvement. Although more than anything it just appears that 2012 was a down year. This is true for most NHL teams too. So I wouldn't read into 2012 much.
So did teams actually get any better at correcting for league-wide biases in my sample? It doesn't really look like it to me. I'm confident they didn't get worse, but an overarching idea of improvement is far from obvious.
While this can't prove the biases I identified exist today, the fact that the league as a whole did not improve over a nearly decade-long sample makes it more likely many still exist today.
How would you rate this article?
Follow Us On Social


